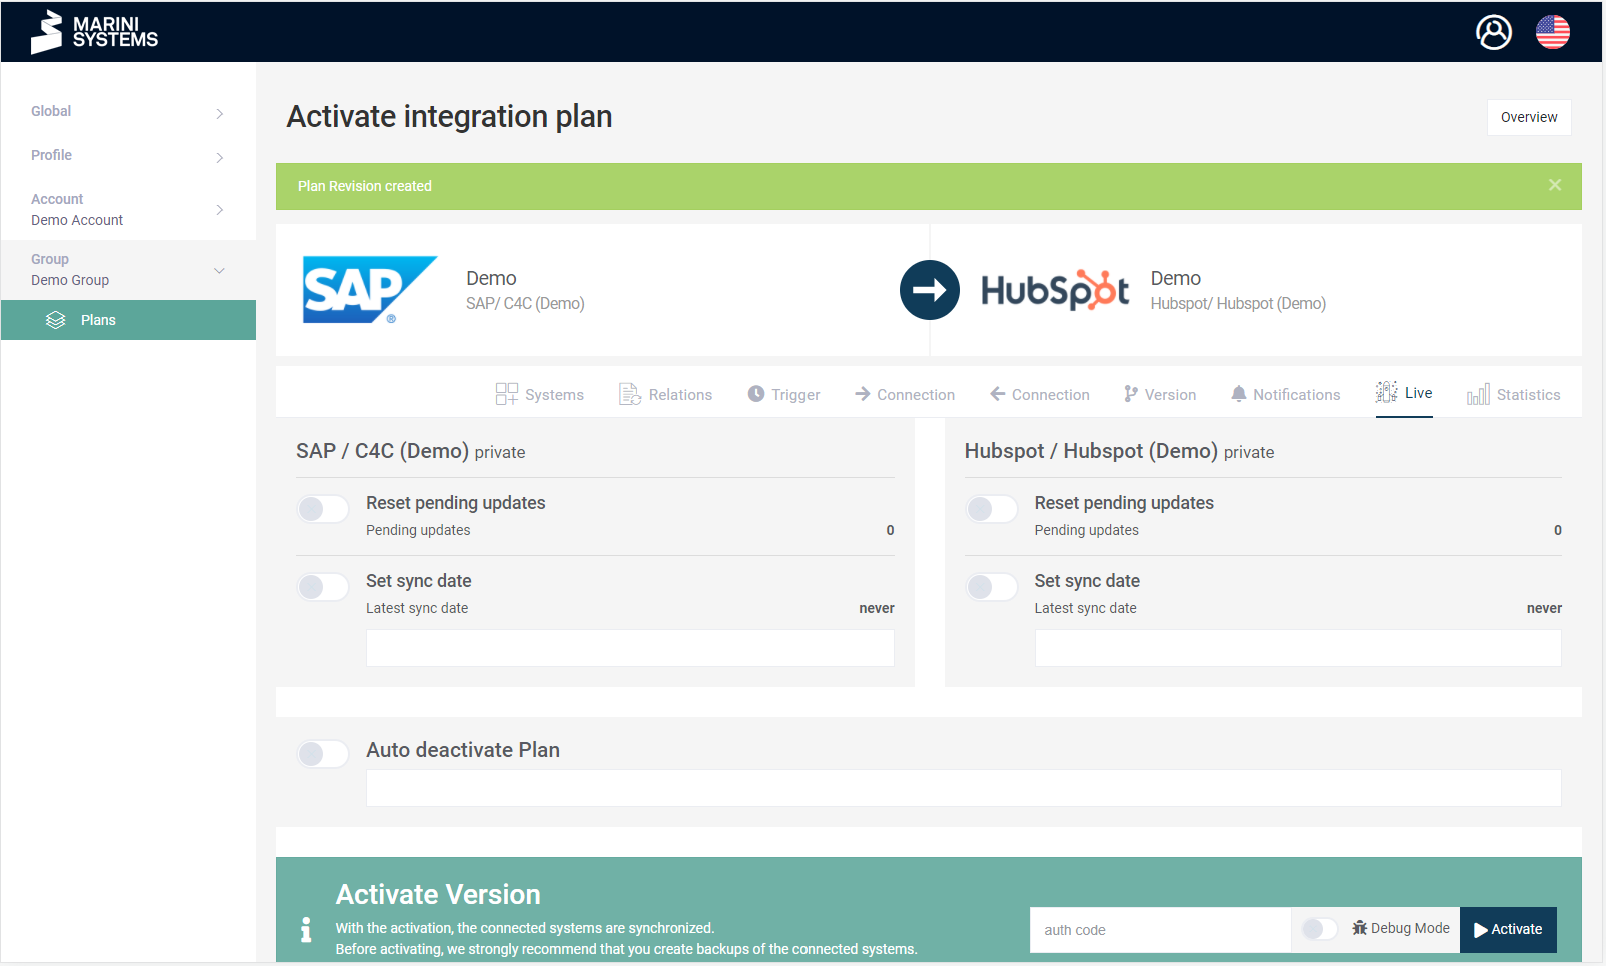
When you deploy plans, you can enable the debug mode. The debug mode grants you much more detailed logs. If you want to deploy a plan, you have the option to check the debug mode in the mask directly next to the “Activate” button.
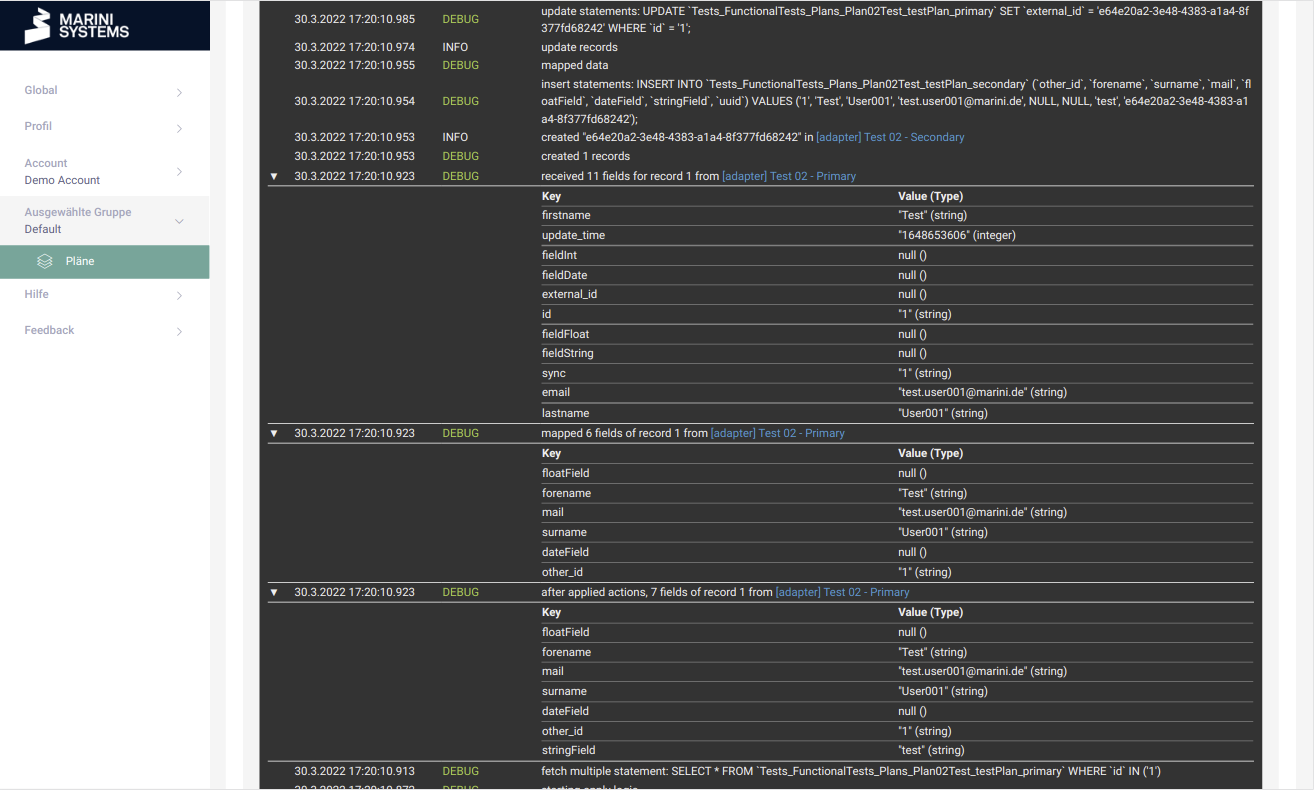
After you have activated a plan with debug mode, you can view the extended logs in the “Statistics” tab.

For example, all values of a record that is transferred are displayed. In our case, the record “e65e20a2-3e48-7383-a1a4-8f377fd68242” was successfully created. We see listed which fields were fetched (top table), which fields were mapped (middle table) and which fields are transferred after an action was executed.
Exactly one action was executed: The value “test” was written to the field “stringField”. This allows the synchronization to be traced in detail. Even the statements for fetching and writing the record are displayed.
If an error were to occur during the transfer, the debug mode is a good way of tracing what caused the error.