When you open a plan, you can historically view the statistics of the
- Logs
- Plan executions
- Relations
- API calls
under the tab Statistics.
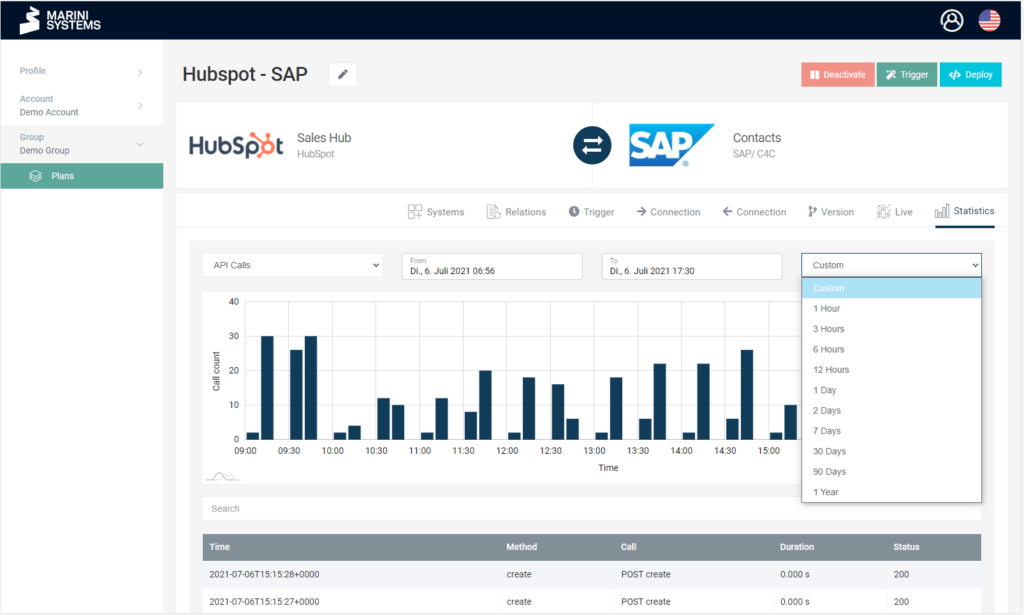
API Calls
The bar chart shows you the number of API calls in the selected period. You can easily adjust the time period via the tabs. You can also select a fixed period in the right drop-down menu (for example, 1 hour).
The table below shows you the individual API calls. It reacts dynamically to the time period you select at the top. The table contains the following information:
- Execution timestamp
- Method
- Call
- Duration
- Status
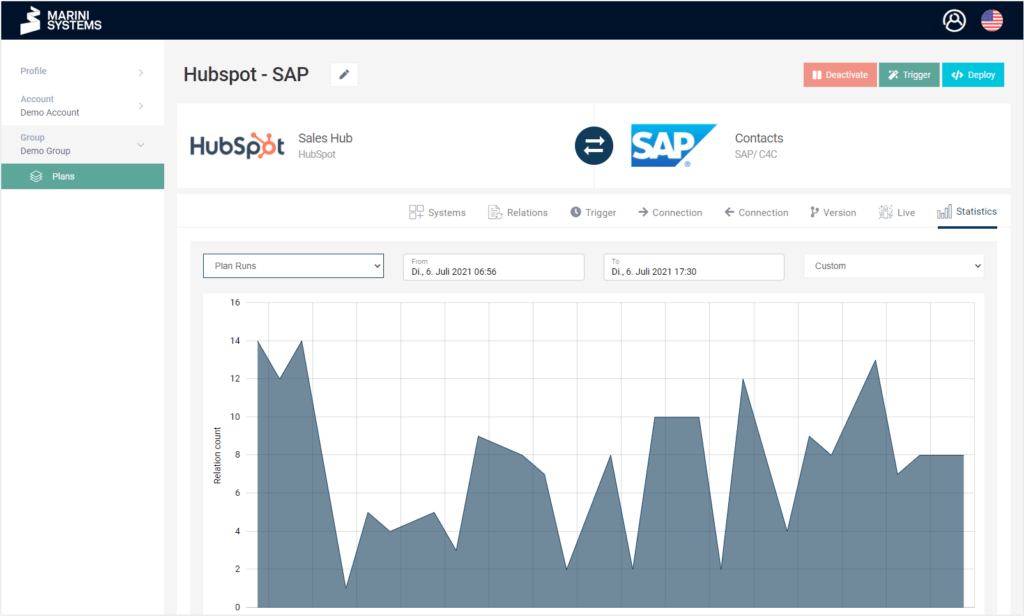
Plan Executions
The line chart shows you the amount of plan executions in the selected period. You can easily adjust the time period using the tabs. You can also select a fixed period in the right drop-down menu (for example, 1 hour).
The number of plan executions depends on the trigger modalities. You can choose between
- Scheduled
- Web-hook
- Manually
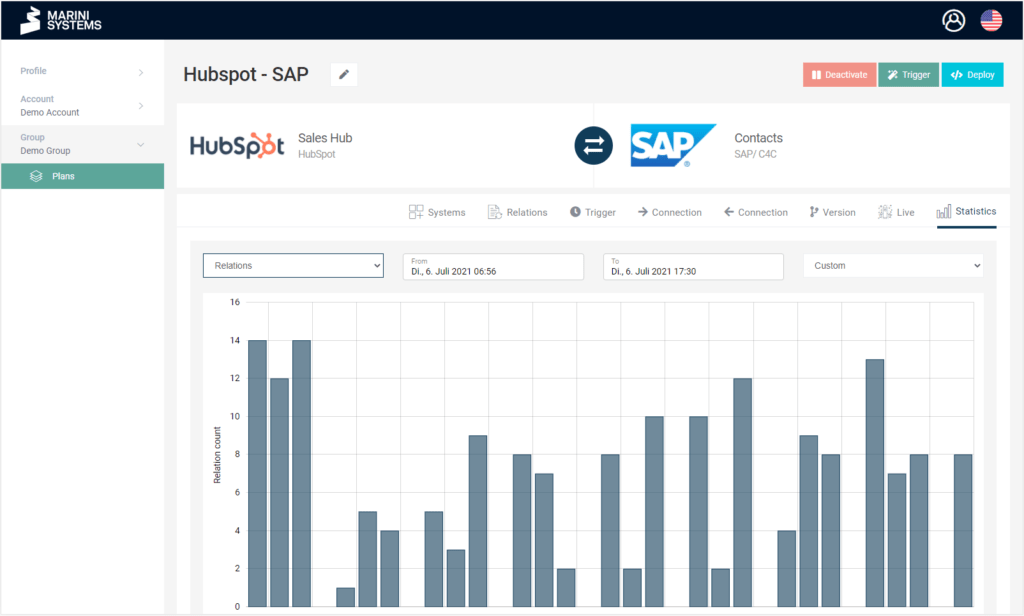
Relations
The bar chart shows you the number of relations added in the selected period. You can easily adjust the time period using the tabs. You can also select a fixed period in the right drop-down menu (for example, 1 hour).
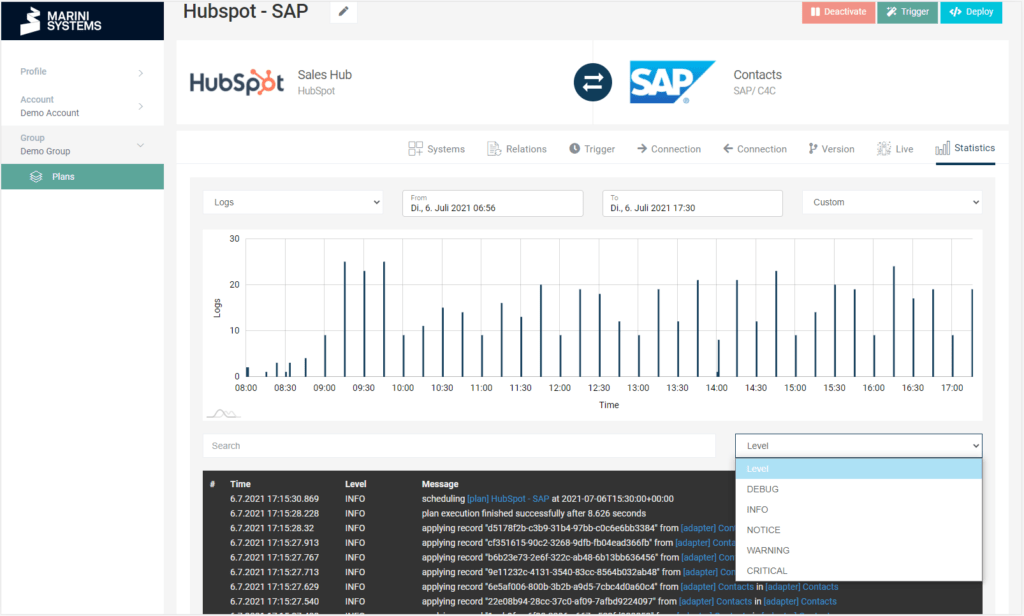
Logs
The bar chart shows you the number of generated logs in the selected period. You can easily adjust the time period via the tabs. You can also select a fixed period in the right drop-down menu (for example, 1 hour).
In the table above you can see the individual logs. It reacts dynamically to the time period you select at the top. You can filter by log level as well as search for specific logs by entering text.