In short: near real time
To answer the question properly, we need to take a closer look at the synchronisation process without going into too much detail. The basic sequence is sufficient, whereby we distinguish from activation to completion in only three phases.
- Trigger
- Execution start
- Execution duration
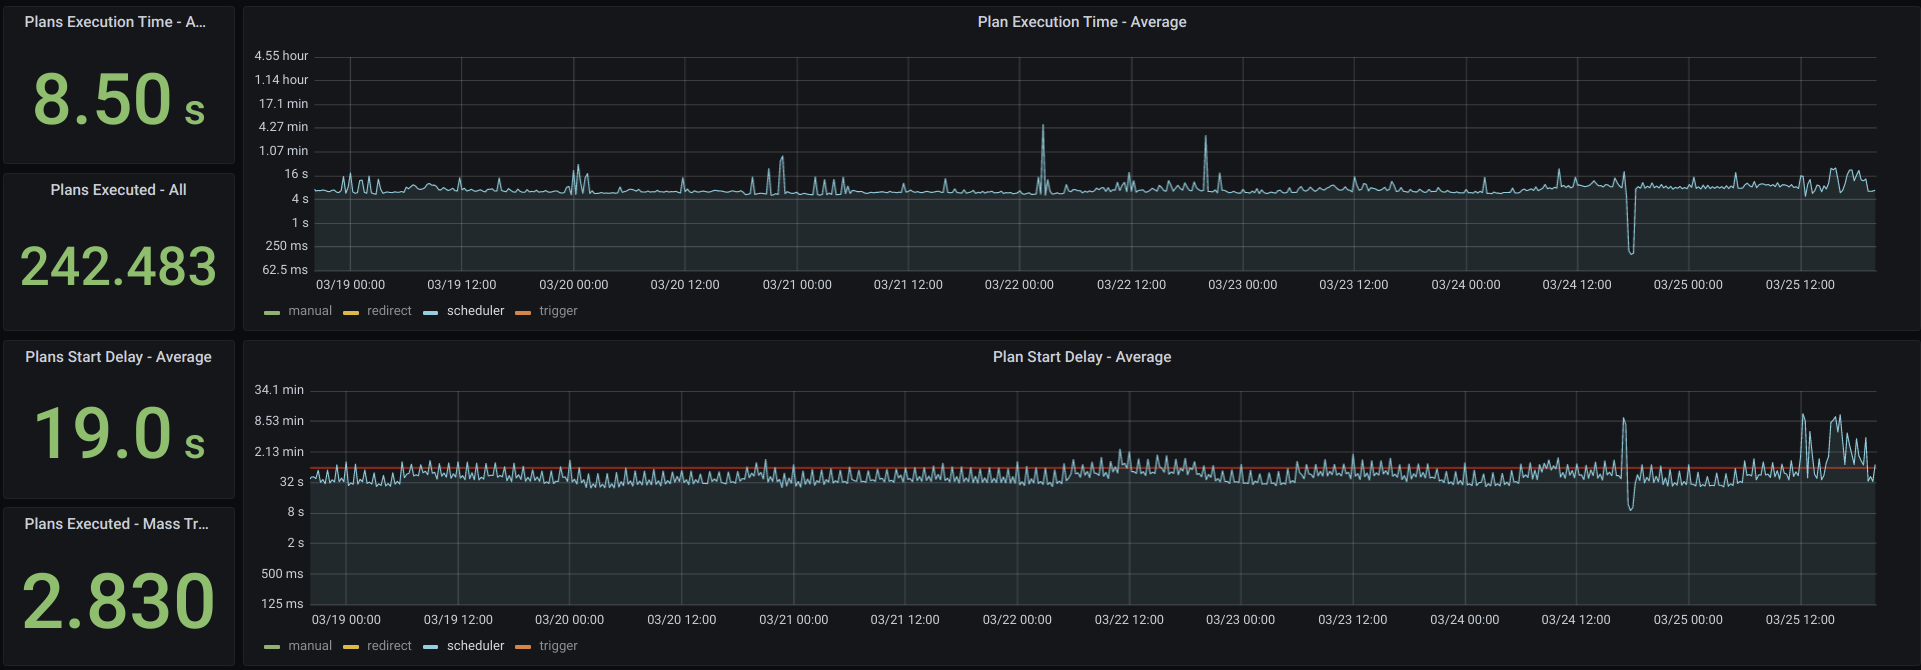
For the three phases, we have produced an evaluation of 239,653 plan executions (see chart, as of 2021-03). Note: In each execution, all records to which set conditions apply are synchronised. Therefore, only a few or very many records can be synchronised with one execution.
1. HubEngine-Plan Trigger
The execution of a HubEngine plan can be triggered by various methods (trigger: time|hook|manual). Triggers are accepted in real time. There is therefore no delay in this phase.
2. HubEngine-Plan Execution Start
The synchronisation tasks are processed in parallel and efficiently. Nevertheless, it is often not possible to execute the requests immediately. In our observation interval, the actual execution is started after 19.0 seconds on average (cf. chart, “Plans Start Delay – Average”).
3. HubEngine-Plan Execution Duration
For simplicity, we summarise the complete synchronisation of data under this point. This includes the interactions with the connected systems and the execution of the plan logic. We can neglect the internal processing. This is usually only a few milliseconds, although complex conditions and mappings also take more time. Interaction with the systems, on the other hand, takes the most time (latencies). On average, we need about 8.5 seconds (cf. chart, “Plan Execution Time – Average”).
Conclusion: In the observation interval, we needed an average of 27.5 seconds for a complete synchronisation. It is possible that a synchronisation with a lot of data or with a high complexity takes longer – or runs faster with a low complexity and a low volume.
