Definition
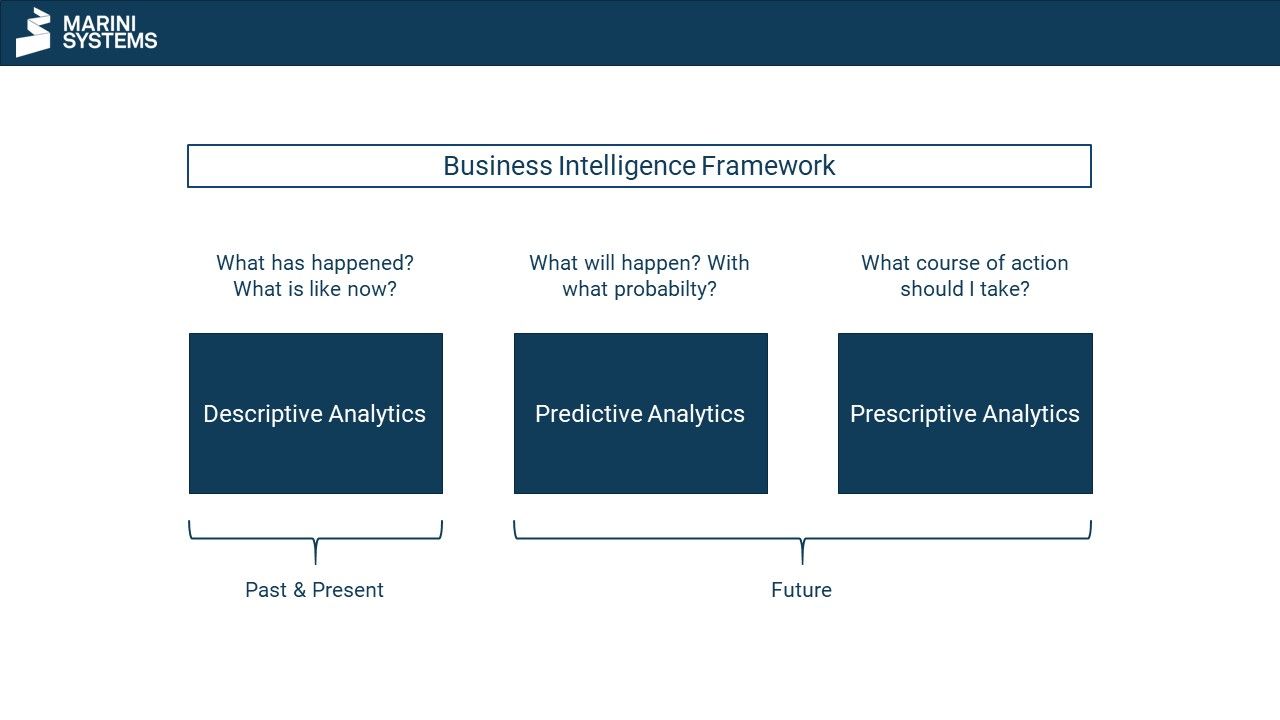
Predictive analytics – in contrast to descriptive analytics – looks at the future and makes predictions about it. Future events and states are predicted. Will a customer close a contract or buy a product? Which product is the customer most likely to be interested in? What do my sales figures look like in the future?
In order to make forecasts, predictive analytics uses various methods from the field of statistics and machine learning (see next section). For this purpose, conclusions are drawn from past data within the models. These serve as the basis for predicting future events and conditions.
Pros and cons of Predictive Analytics
On the one hand, this is the great strength but also the great weakness of predictive analytics. Past data is often very well suited to predicting the future. As a rule, it is more precise than heuristics or random guessing. However, the future is uncertain and depends on so many factors that they can never be modelled. This means that forecasts are always associated with uncertainty. The patterns that applied in the past do not necessarily apply in the future. Moreover, it is possible that certain patterns from the past should not be repeated (Garbage in, Garbage out).
To summarise the meaning of predictive analytics in one sentence: It is about making more precise predictions than would be possible through simple heuristics or blind guessing. It is not crucial to make an exact prediction in each individual case. It is more important to provide more precise predictions on average.
Methods of Predictive Analytics
The procedures can be differentiated into econometric and “machine learning” methods, sometimes also referred to as artificial intelligence methods. Furthermore, a distinction should be made according to whether a category, e.g. purchase or non-purchase, or a continuous variable, e.g. turnover or profit, is to be forecast.
In the case of categorical events, probabilities are estimated. In econometric methods, binary logit models, also called logistic regression, or binary probit models are often used. In machine learning, decision trees are traditionally used, often combined with ensemble methods such as bagging, boosting and random forest. Recently, neural networks have also been used more frequently. Less frequently, “support vector machine” methods are used.
Regression analyses are often used for continuous variables. In the field of machine learning, regression trees, model trees and “nearest neighbour” methods are also used.
Einsatzbereich im Vertrieb
Support of Sales
Predictive analytics helps salespeople prioritise customers. Models can provide a score for each customer per product, enabling salespeople to target the most promising customers first. Predictive analytics enables the following predictions, for example:
- Closing scores for different products
- Customer lifetime value (CLV)
- Assigned segments (clustering)
- Next-best-action
- Churn score
Management and Controlling of Sales
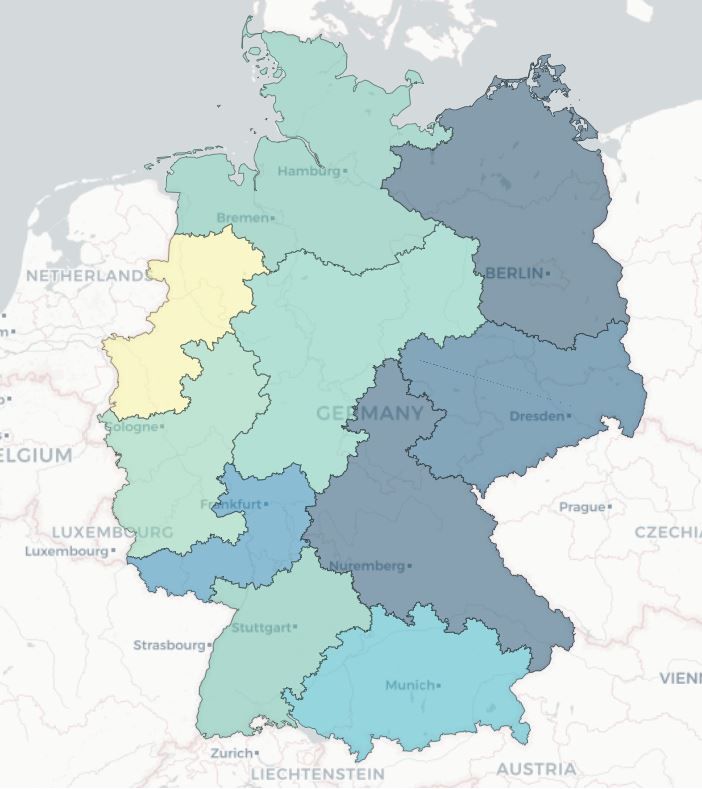
While the individual representative works at the customer level from a data point of view, sales controlling looks at the data in aggregated form. Aggregations can be done by geographical regions, product lines or other arbitrary allocations. Here, too, a distinction can be made between descriptive analytics and predictive analytics. In both areas, meaningful dashboards can be used for sales controlling.
The figures and metrics to be considered are often not very different from those used by individual salespeople. However, this data is now aggregated to allow comparability between, for example, geographic regions or product lines.
Below are some examples of key figures and metrics already used in dashboards by our clients:
Descriptive Analytics
- Number of units sold in region X in period X
- Number of customers in regions
- Monetary contribution of all customers in region X
Predictive Analytics
- Sales potential in region X
- Total customer value (CLV) in region X
- Expected turnover in region X
The visualisation can be done via interactive tables, graphs and geographical maps.