Definition
In the Business Intelligence Framework, Prescriptive Analytics is probably the most difficult to define and least tangible area.
Prescriptive analytics uses the results of descriptive analytics and predictive analytics and derives recommendations for actions to obtain an optimal result. These can be, for example, the maximisation of profit, the maximisation of purchase probabilities or the minimisation of costs or risks.
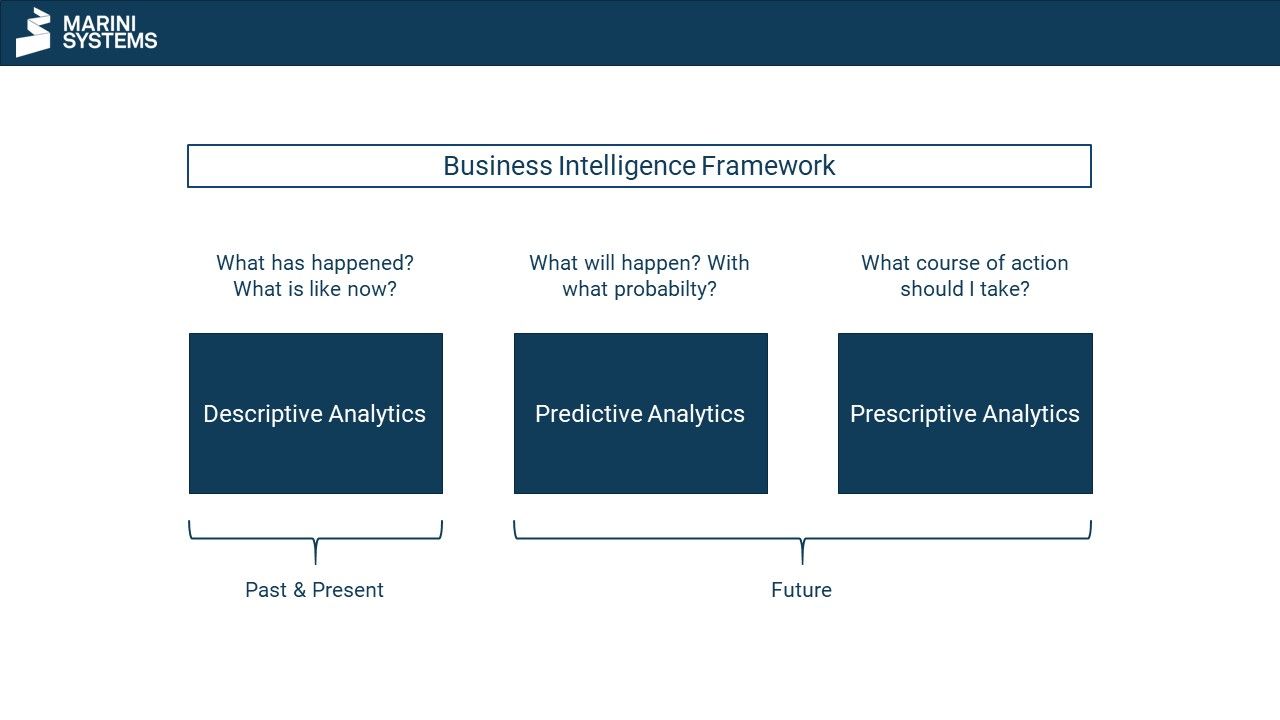
Prescriptive analytics provides concrete recommendations for actions to influence predictions made. It thus estimates the influence of certain actions on future events and states.
An example from sales
In the following, we illustrate a business intelligence case for sales with a focus on the prescriptive analytics part. The question we consider now: What measures should I take to reduce the churn rates of my customers?
Descriptive Analytics
First, we analyse which people have churned in the past. In other words, what are the average characteristics of those who churn? This may reveal, for example, that people with a high number of complaints tend to churn more often on average.
Predictive analytics
Now machine learning models are estimated that quantify the churn risk as a probability. Methods such as random forest, gradient boosting or neural networks are particularly suitable for this. Insights from descriptive analytics are also used to carry out the modelling (model building).
Prescriptive Analytics
Now churn risks are quantified as probabilities per person. However, this does not yet determine what measures should be taken to prevent people from leaving. This is where prescriptive analytics comes in.
There are defined options to choose from that could reduce the risk of churn. In our simple and hypothetical example, there are three options to choose from. These are based on findings from the descriptive analytics phase. The number of complaints should be reduced so that people do not churn.
- Salespeople could contact customers with a high likelihood of churn more frequently to reduce the risk of churn and prevent complaints.
- Patterns could be identified within complaints. These would be used for product improvement to reduce the average number of complaints.
- Potential churners could be offered better pricing conditions.
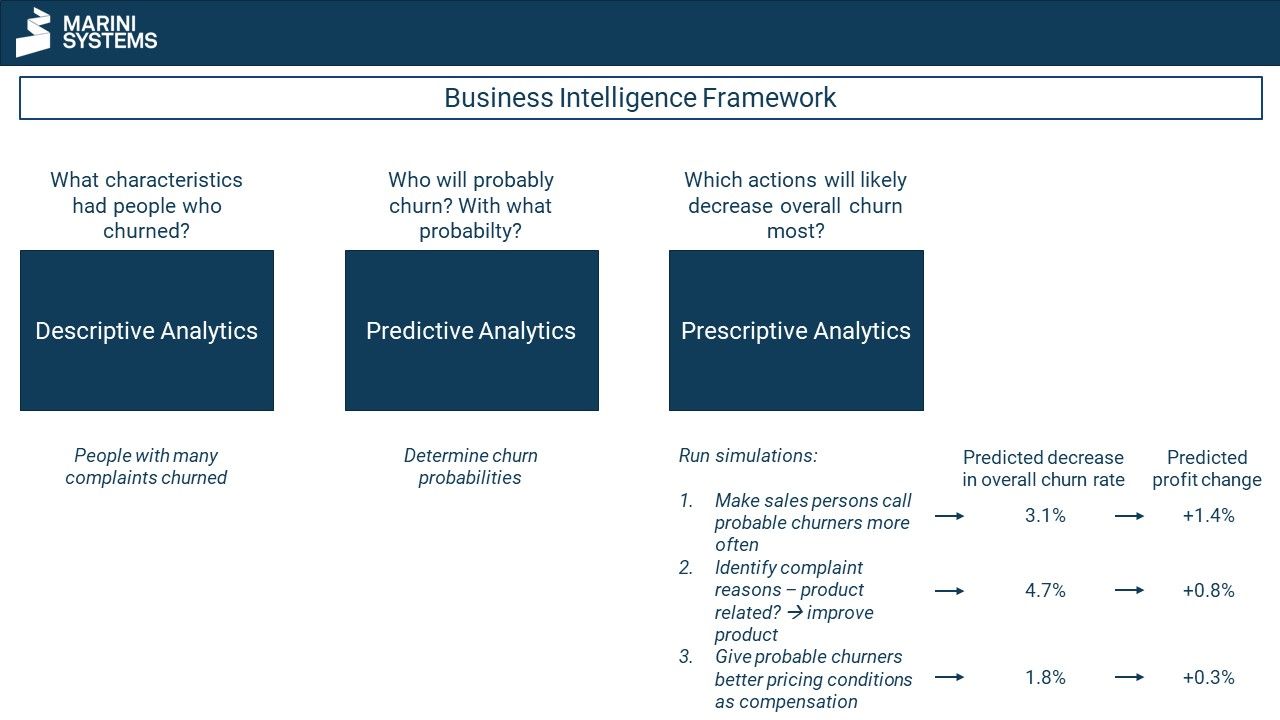
Prescriptive Analytics now calculates and estimates simulations with mathematical and statistical models for the respective scenarios and calculates target variables such as reduction in the global churn rate, resulting costs and projected profits. The change in churn rates would look like this:
- -3.1.%
- -4.7%
- -1.8%
Now, taking costs into account, the three scenarios are evaluated in terms of expected profit. Although measure 1 is predicted to result in a smaller reduction in the churn rate, it is estimated to have a higher change in profit than measure 2.
Prescriptive analytics would thus provide the answer as to which measure should be implemented. Business cases can be designed and scaled arbitrarily in complexity in Prescriptive Analytics. Multiple scenarios, combinations and interactions are conceivable. However, as complexity increases, so does the fuzziness of the predicted results.
Conclusion
This example describes a hypothetical use case of prescriptive analytics. Measures could be triggered or realised by the systems in real time and automatically. Over time, the models underlying prescriptive analytics would be improved (via machine learning) by feedback in the form of new data. They become more precise.