Du kannst verschiedenste Reports und Diagramme in der DataEngine erstellen. Eine kleine Übersicht findest in den Screenshots unten.
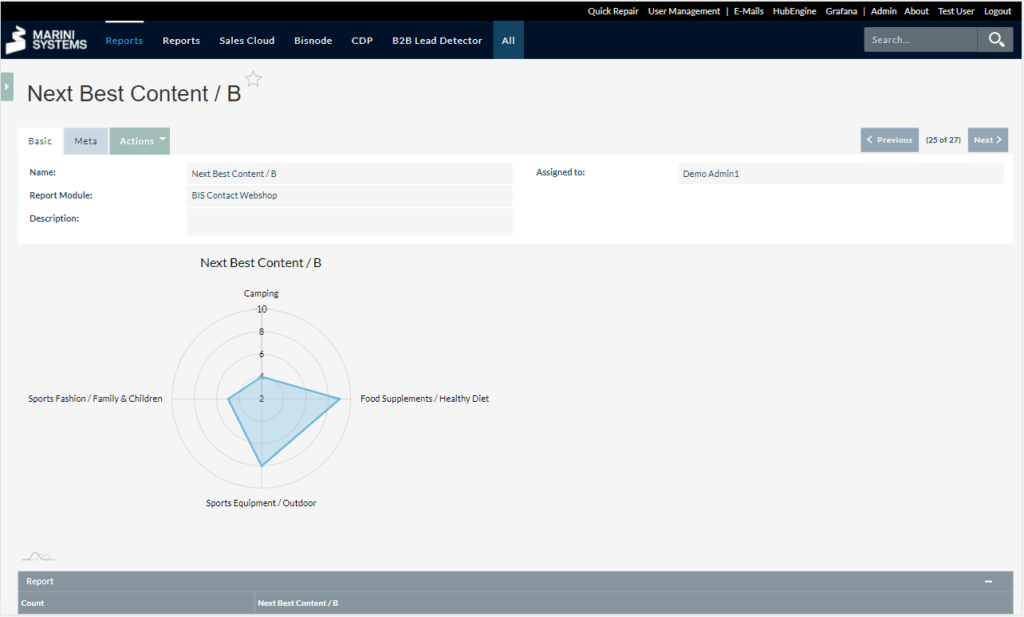
You can even use radar charts as an alternative to simple column charts. Use whichever you prefer and build your custom dashboards.
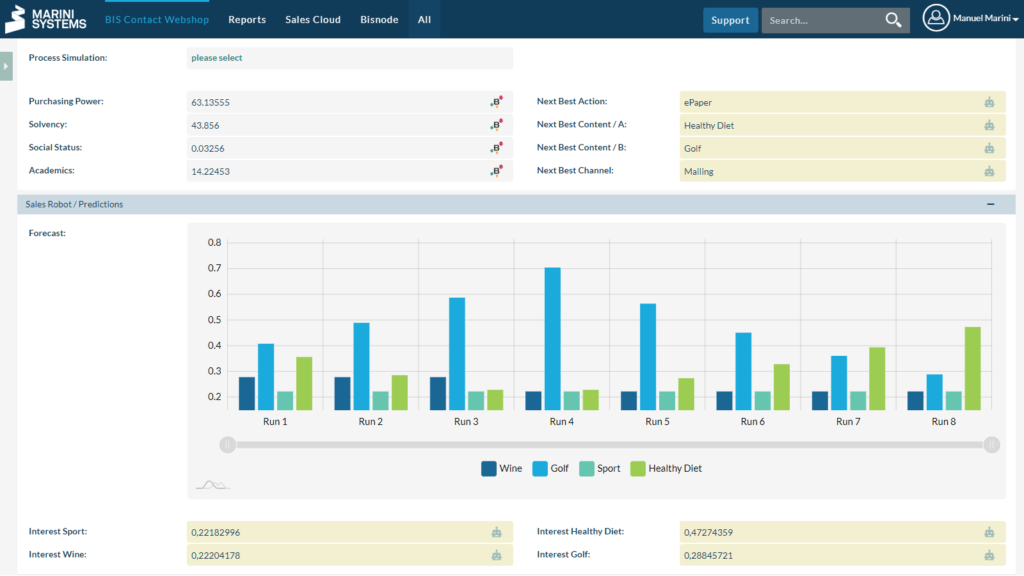
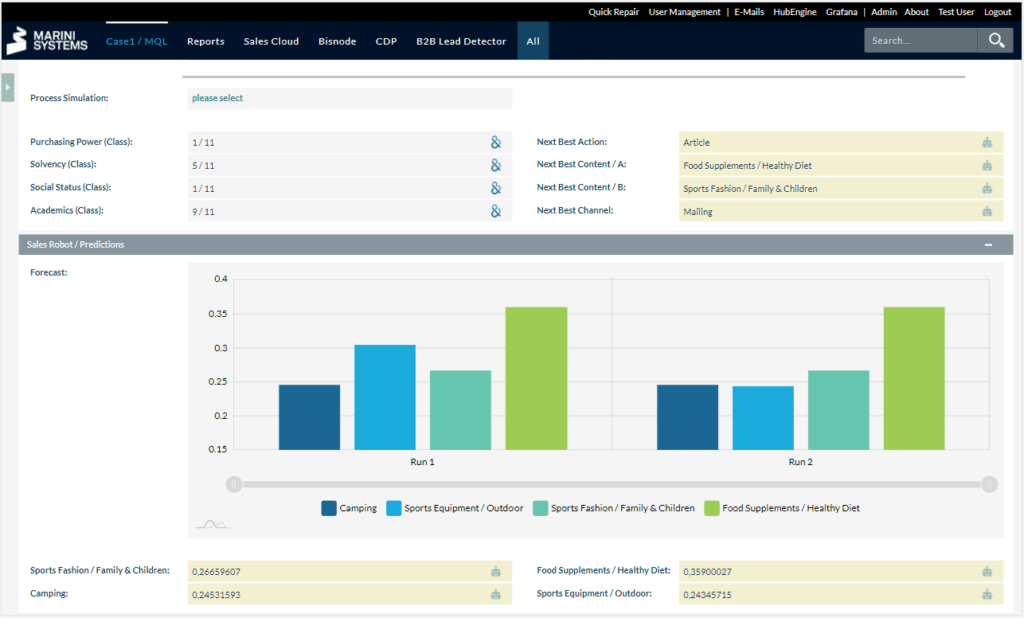
The predicted interests are recalculated based on defined triggers (in workflows). Here it was recalculated seven times. You can see that golf decreases whereas healthy diet increases over the runs. If a statistical model should be used for calculation, then a third party service needs to be integrated.
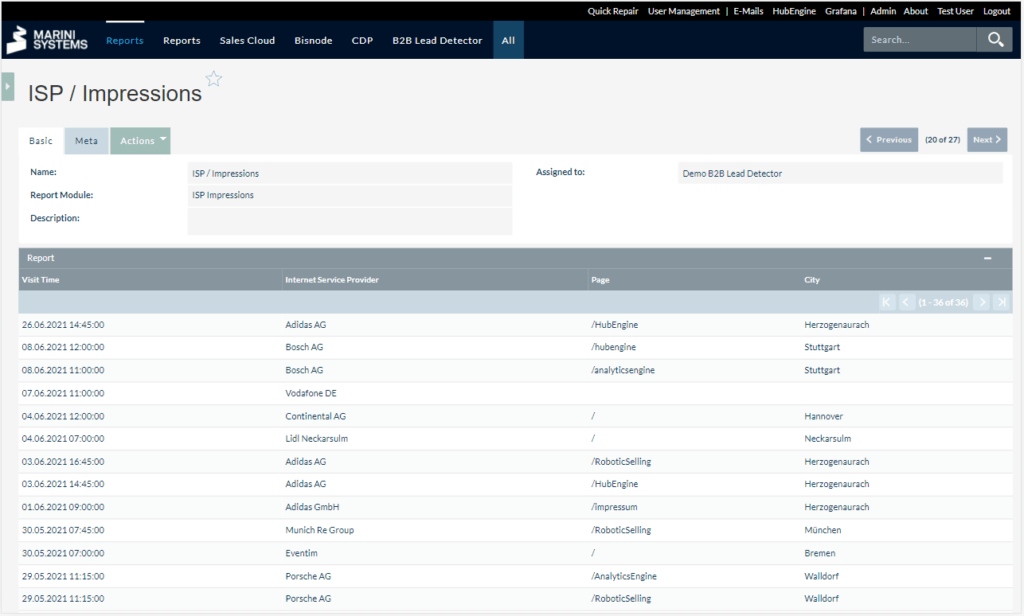
Remember that reports are tables of one module or across multiple modules in the DataEngine. So you can simply produce plain tables. For instance, this report of website impressions could be exported for an in depth analysis with Excel, R or Python (or other tools).
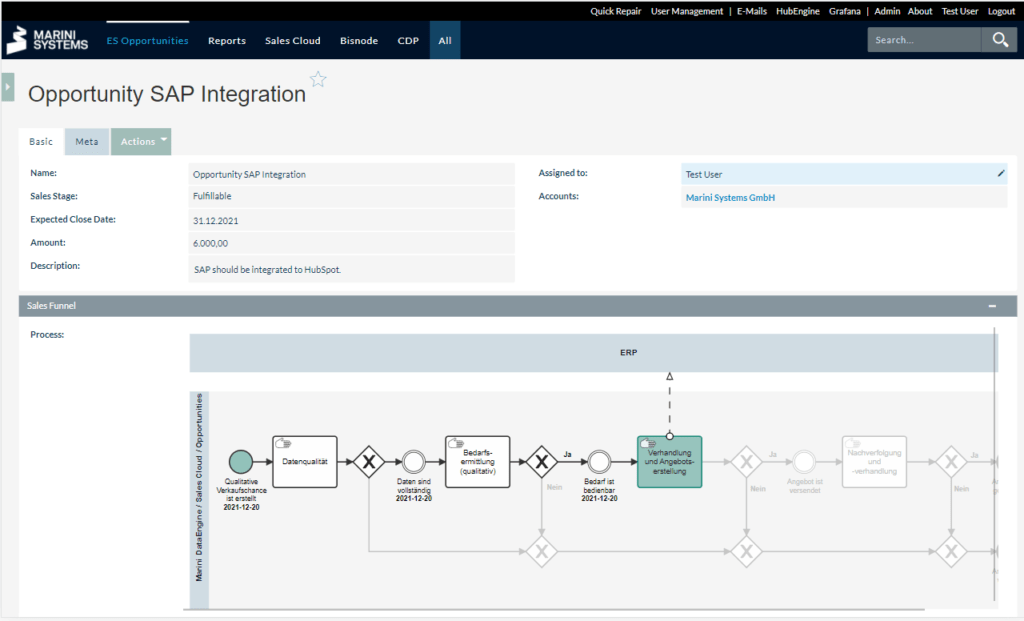
The BPMN process depicts an opportunity process. The current state is at Negotiation (highlighted in green). It continues if the necessary data changes in the DataEngine. This could be done manually or in an automated way.
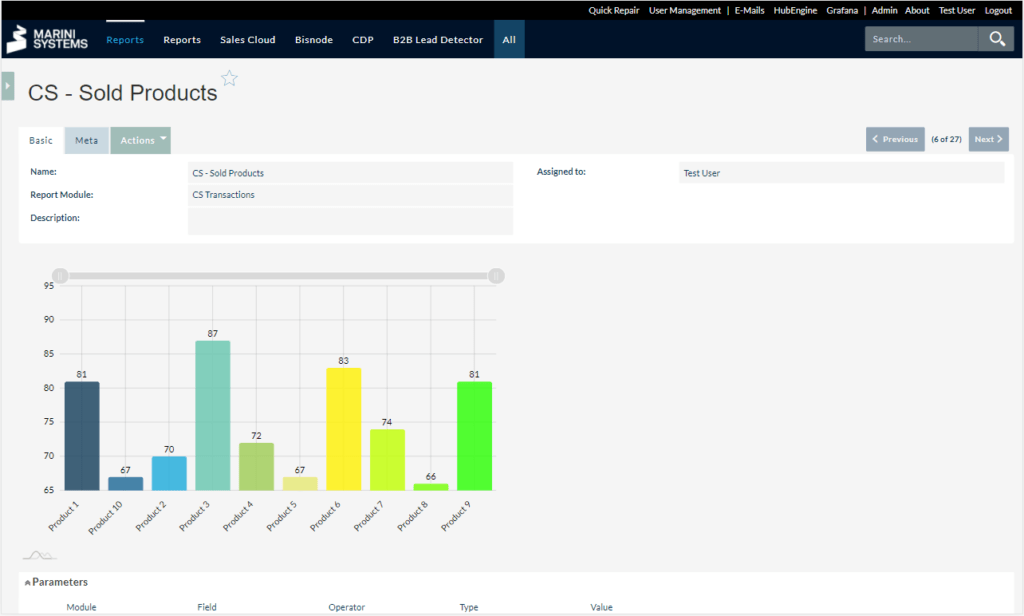
This report shows number of products sold in a column chart. You can configure all marketing and sales analyses you need. Such data could come from an ERP Integration.
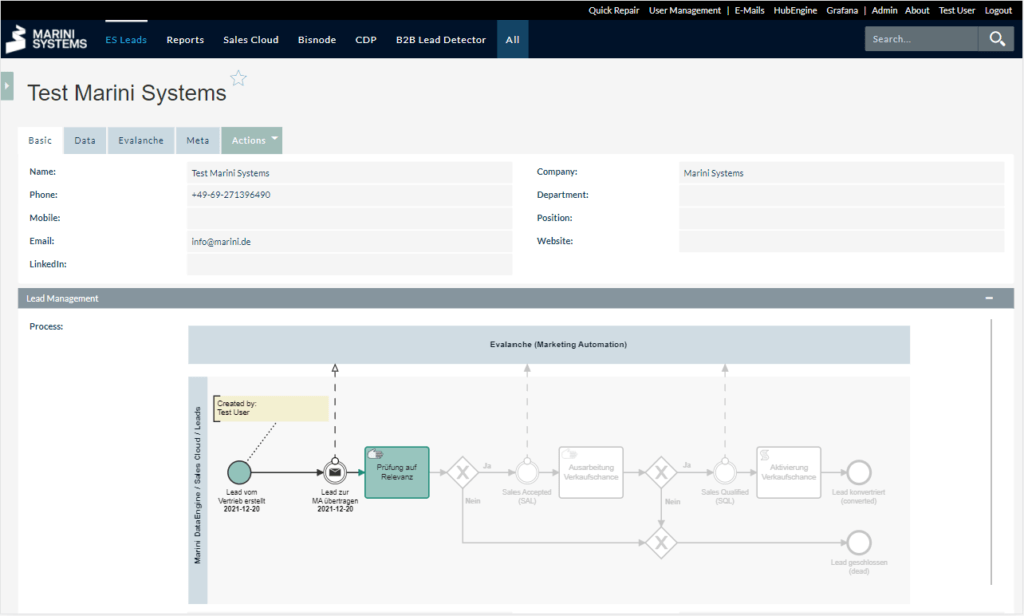
Basically every BPMN process can be depicted in the DataEngine. You see a lead management process here with integrated data from Evalanche.
You can freely configure the detail view of a record in the DataEngine. Each subpanel is completely individual. As you can see, even charts and diagrams can be included.
It is not obligatory to produce charts and diagrams with reports in the DataEngine. You can simply produce a plain table that you need.
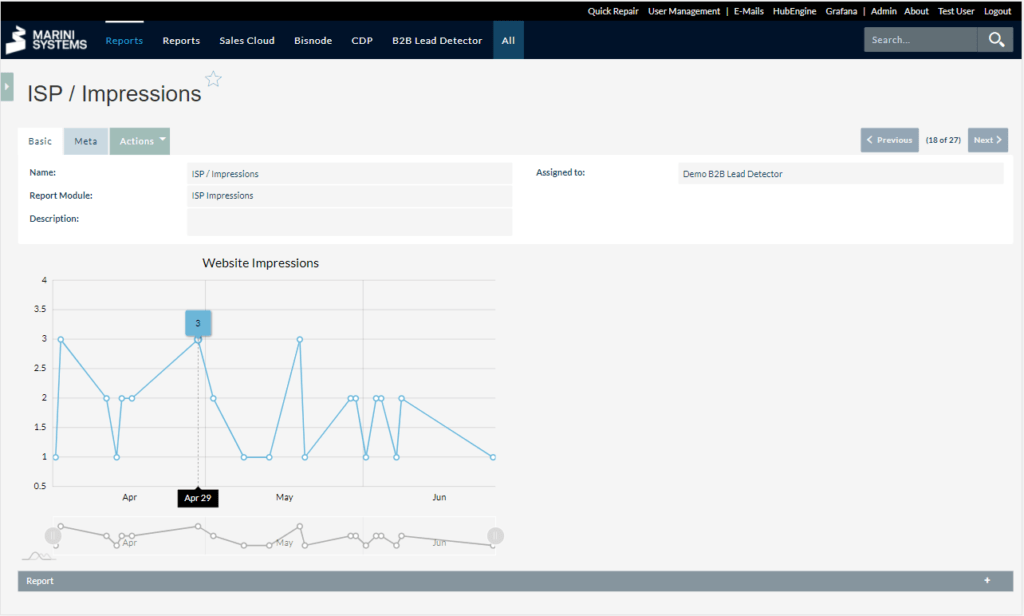
This line diagram shows the number of impressions of a website per day (test data). This chart could be combined with other reports to explain traffic peaks. Impressions can be integrated via any web analytics tool (e.g. Google Analytics).
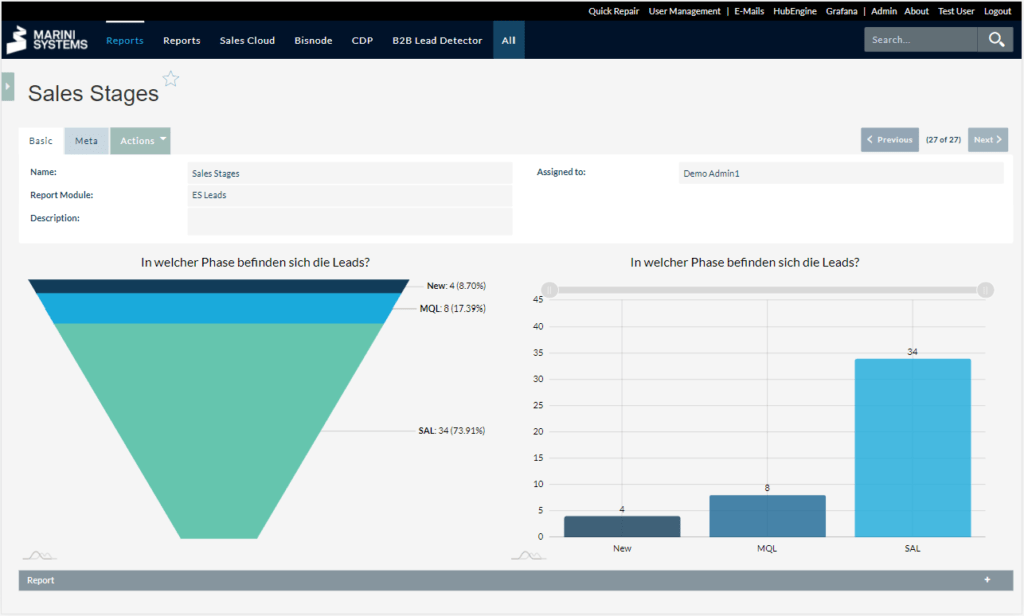
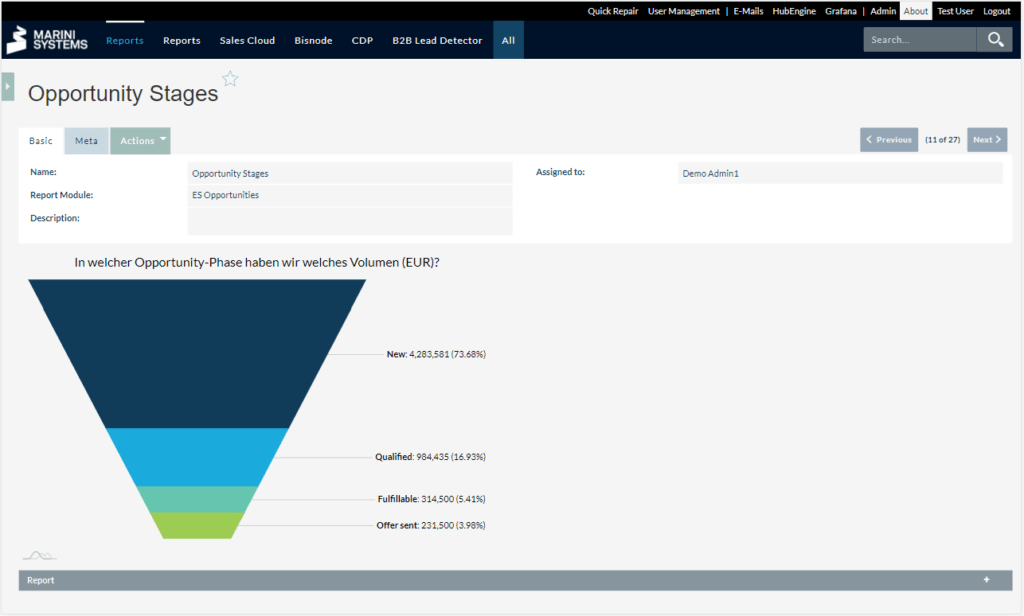
You can even configure sales funnel. Moreover, it is possible to produce multiple charts from one report - given the underlying data basis is the same.
The chart or diagram is not bound to a specific content of data. With a funnel you can display opportunities, leads or other types of conversions. Leads could be integrated from a marketing automation application such as Evalanche or Mautic.
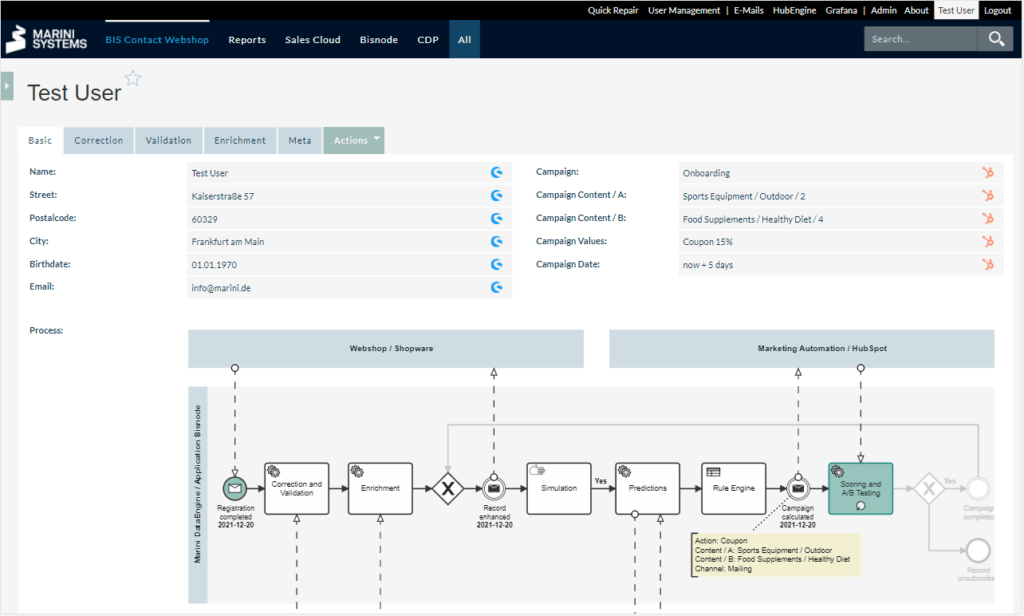
You can display any process with BPMN in the DataEngine. The black paths were taken, all grey paths were not taken. So you can distinguish the process routes. The current state is colored in green. Here it is at Scoring and A/B Testing. The icons indicate where the respective data comes from (e.g. campaign data from HubSpot).
Sales Qualifiying Process (SQL). The process has ended successfully with the acception of the lead (SAL). You can recognize this because the end event of the BPMN process is green. Data from Evalanche is processed in the DataEngine and afterwards synchronized to SAP via the HubEngine.
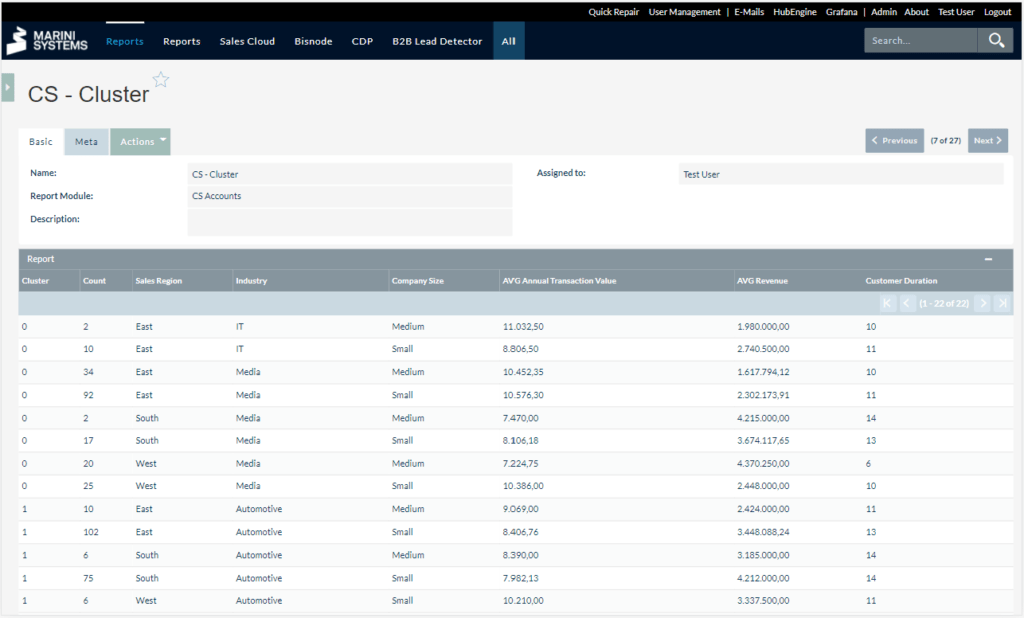
The monetary potential and monetary value of all transactions per region is displayed. The transaction data could come from an ERP Integration. The potential can be calculated in the DataEngine if there is no need for a statistical model. Otherwise a further analysis tool must be integrated.
Here, a line chart is used to depict the forecasted closing probabilty of an insurance over time. The forecast comes from an integrated third party service providing statistical predictions.
Such easy reports as this pie diagram do not contain much value of its own. However, remember that reports are intended to be used in dashboards. In combination with other reports even this pie diagram can be useful. Such dashboards are used in centralized platforms, more specific in a CDP.
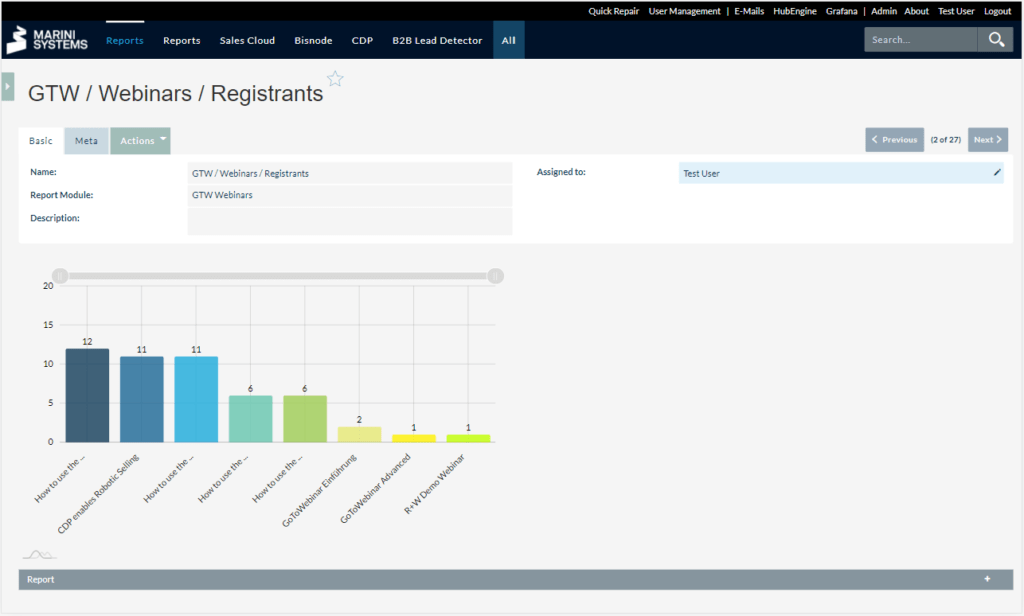
This report shows number of registrants for different webinars in a column chart. You can sort the data descending. This is configured in the report. So you can immediately see the most popular webinar. The orchestration of the webinar process with other systems, such as Evalanche for consent collection, is handled in the DataEngine.